

Training Benchmarks and Tracking Metrics
There’s a plethora of advice online about training metrics and the benefits to tracking these, so much so it can be incredibly confusing to work out what you should be doing. Of course, it doesn’t help that much of the recommendations of what to track are from the tech companies who want you to buy their latest tracking tool! Let’s see if we can come up with an answer.
The first step is understanding what it is you are trying to accomplish, or what problem it is that you are trying to solve. What metrics you track should be determined by this. The internet would have you believe that you must track all possible metrics in order to better improve your performance but the reality is that is generally just a pile of detailed yet confusing data that can be difficult to collate to our training. By starting out by identifying the specific problem / goal that you are addressing, you ensure that you are not bothering with things you simply don’t need.
At Blackthorn Strong, we don’t have a “universal” for all athletes, and do change what training benchmarks we use, and what training metrics we track, depending on the athlete and their goals. That being said, there are some universal recommendations and observations to give to those who are programming their own training.
This article looks at the training benchmarks we suggest you use and what analysis tools we think are most applicable to Adventure Athletes.
Training Benchmarks
Let’s focus in on the three benchmarks we use the most:
RPE
We believe that RPE (Rate of Perceived Exertion) is the most important and useful metric for most, especially those who are training without professional support.
RPE is a subjective scale used to assess an athlete’s exertion or pain level. It was created in 1ht 1960s by Dr Gunnar Borg, who proposed two scales: the 6-20 scale and the CR10 scale (1-10).
Although we use the 1-10 scale, as athletes find it more intuitive, it is worth highlighting the 6-20 scale, as it can sound a little odd. Dr Borg found a correlation between the number an athlete chose on this scale multiplied by 10, and their actual heart rate. So if an athlete was working hard walking uphill and described their RPE as 15, there’s a high chance their heart rate would be around 150.
We use the CR 10 scale. 0 is no exertion (resting) and 10 is the highest, Below is a table issued by UESCA that explains the scoring:
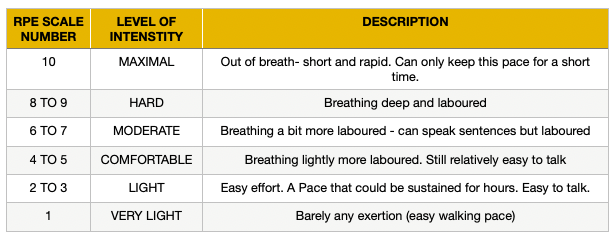
Clearly this is very subjective and will vary from athlete to athlete. An athlete’s pain tolerance can have a significant effect on how they score certain efforts, so we tend to perform a Lactate Threshold test on our athletes to help better understand their perception of exertion.
HEART RATE
Heart rate has long been a benchmark metric for sport. Although heart rate has value in the right circumstances (we do use this with our athletes) it is not always useful with Adventure Athletes.
Heart rate is a reflection and response to an athlete’s total stress level, as opposed to just from the activity. So altitude, heat, cold, sickness, menstruation, caffeine, hydration, fatigue etc can all cause a shift.
Another notable issue with heart rate as a metric is something called “Cardiac Drift.” Essentially, this Is the natural increase in heart rate, despite the current effort level / intensity remaining the same. This is mainly due to fatigue and a raise in body temperature. This can cause issues, as if we ask an athlete to do a training session in a set HR zone and they experience Cardiac Drift, they will likely be under training.
That being said, we do use Heart Rate as a benchmark with following and we do use heart rate zones when programming (some) training. We find that a lot of athletes prefer the septic “numbers” approach that heart rate zones offer.
Note that heart rate can also be a useful indicator of an athlete’s status. A comparatively low or high resting heart rate can signal fatigue or overtraining. The inability to raise an athletes heart rate to a level that normally corresponds with that intensity, or if the heart rate does not return to normal in a timely manner after intensity can also signal fatigue or under-recovery.
LACTATE THRESHOLD
This is the level at which blood lactate accumulates in the bloodstream. This happens when lactate clearing is exceeded by lactate production.
Dr Jason Karp, a professor at Georgia Southern University, describes that running at Lactate Threshold should feel “comfortably hard.”
Lactate threshold is a useful benchmark for judging intensity during training and racing. There are a number of benchmarks used for Lactate Threshold and which one to use can be confusing at best. Our preferred Lactate Threshold tests are the Talk Test and the Lactate Threshold Heart Rate Test.
Talk Test: The talk test was initially pressed in 1939 asa way to advise mountaineers to pace themselves. The actual protocol of the test changes between coaches and establishments, but the theme is the same: that the exercise increases at set intervals, while a specific sentence is spoken at the end of each interval. In principle, there are three observable levels:
Easy (below threshold): Athlete can speak easily.
At Threshold: Athlete can speak, but only a sentence can be said before breathlessness.
Hard: (way over threshold): Can only speak with high difficulty or not at all.
Lactate Threshold Heart Rate Test: After a 10-15 warm up, the athlete runs at the hardest pace they can comfortably sustain for 30 minutes. The average heart rate taken for this 30 minute effort is the LTHR.
BONUS Benchmark: Toughness
The reality is that you can train as hard as you can, use all the tools and science at your disposal and can still fall short of your goal if you just aren’t “tough enough.” Now, toughness is hardly a quantifiable or measurable benchmark but it undoubtedly crucial to your success.
Toughness can be trained. By finishing hard workouts, training in inclement weather and continuing despite hardship we train and develop hardship. But: note that this is not the same as training through pain. Pain is not gain, pain is often a precursor or signal of injury.
Training toughness is very nuanced and something that, if done incorrectly or with too much vigour can lead to injury or overtraining. An experienced coach can be invaluable here.
Training Analysis Tools
Before looking at what shiny gadgets are available to you for tracking training metrics and benchmarks, it is worth restating that in our opinion, RPE is the most important and useful metric for most. Investing substantially in technology can be helpful if the various metrics and functions are understood and used well but can be a confusing distraction or, worse, very detrimental if not. If looking at analysis tolls for your training it is advisable to be driven by necessity rather than what the advertisers want you to buy!
Wrist-Mounted GPS Monitors
These are incredibly popular in adventure athletes, not least because of their use as a navigational aid. The ability to record distance, speed, height gain and so on is incredibly useful for athletes and coaches alike. There’s a number of popular brands, but we won’t go into specific recommendations here but will recommend that a focus is put on GPS accuracy.
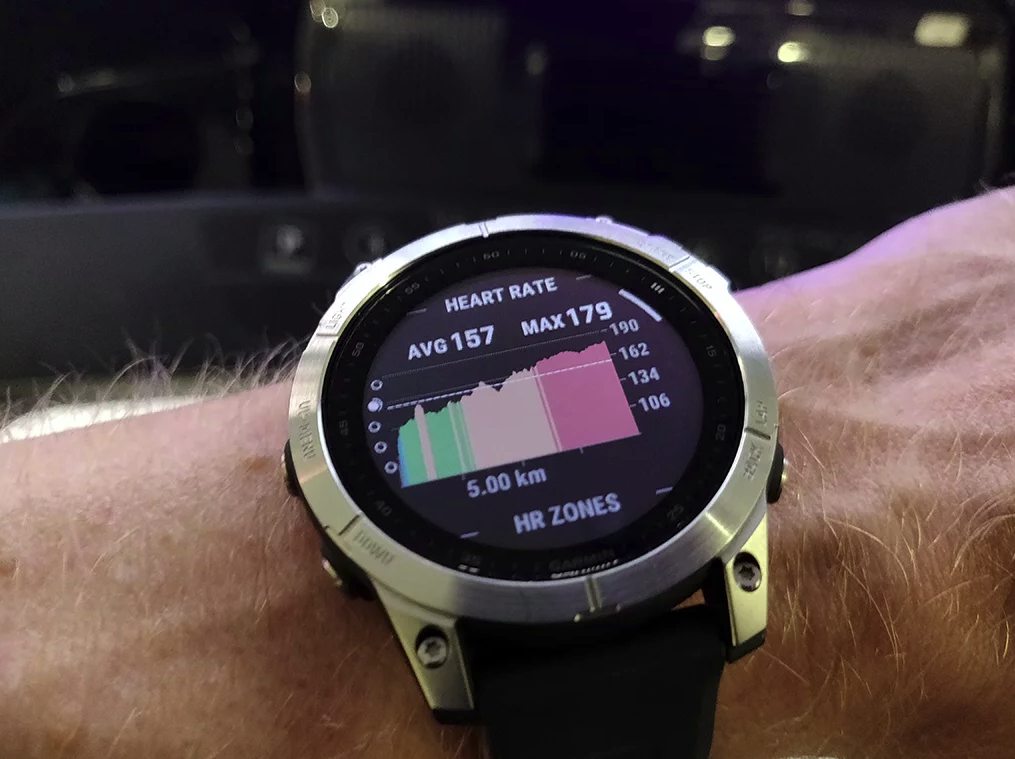
Heart Rate Monitors
Monitoring heart rate can be useful both during exercise and outside of trining, as described above. But it worth noting that, in our experience, wrist mounted HR monitors, as are found in a number of the popular sports watches simply do not cut it in terms of accuracy. This is largely due to the movement of the monitor against the skin ant eh possibly of interference between the monitor and skin.
If an athlete wants to accurately use Heart Rate as a metric, then a chest strap should be used.
Power Meters
Both cyclists and runners can and do use power meters as a useful assessment tool. The usefulness of these varies greatly depending on the technology used and the situation and environment it is used in. Power is an interesting training metric, and used very differently for cyclists than it is for runners. At his time, we don not insist, or even encourage our athletes to purchase expensive power meters as we do not consider them necessary for optimising performance in the fields of adventure. We will, however use them at times for triathletes and cyclists seeking a high level of performance.
Strava
One useful feature of Strava is the segments. This allows you to compare current with past performances on the exact same segment (but do note environmental differences). By comparing time with RPE with segment performcne, we can gain some valuable insights to our progression (or regression).
Tracking Training Metrics

So, what should you track? We will all forever look at our time and distance etc, comparing it to our past performances and that needs no instruction. As coaches, we track a huge amount of data which would be cumbersome, perhaps confusing and certainly monotonous to the adventure athlete who doesn’t want a coach.
So, let’s look at three valuable metrics that can inform your decision as to what technology to use, but also to frame the thought process of metric-focussed training.
Volume stated as Time
Generally (but not always…) we will prescribe training based on duration as opposed to distance. Distance doesn’t take into account the effort differences that come with elevation gain. Many adventure athletes will train on rough trails as opposed to smooth tarmac whenever possible, which makes duration rather than distance a better way to prescribe training. Now, there are exceptions to this. An Ironman training plan will have mixture of duration and distance, for example and some athletes have a particular preference.
Height Gain / Loss
You will need a GPS watch to track this, but for an adventure athlete this is an important metric for judging fitness and performance.
After-Training Feedback
How do you actually feel after each session? This is, of course, subjective but incredibly valuable and should be used to inform your programming. It doesn’t require any specialist technology, but it does require some careful thinking. Do you feel tired after training, or a deeper fatigue? Have you any pain? How do you sleep afterwards? How do you feel immediately after, 6 hours after and 12 hours after?
Hopefully the above give you an insight into the concept of Training Benchmarks and tracking training metrics. Clearly, this is a large subject and every coach will have a different opinion! If programming your own training, our best advice is to keep it as simple as is usefully possible. Over focussing on the numbers and metrics can be detrimental as much as it can be helpful. If using a coach, pick one that you trust! This enables you to get on with the training, and allow them to focus on the numbers. Either way, it is our position that training at random in the hope that you will reach your goal is, at best, asking for luck to help you and at worst totally ineffective. Using the right benchmarks and metrics throughout the right training programme can present substantial dividends.